Table of Contents
Google Chart Plugin
Compatible with DokuWiki
- 2025-05-14 "Librarian" unknown
- 2024-02-06 "Kaos" yes
- 2023-04-04 "Jack Jackrum" unknown
- 2022-07-31 "Igor" unknown
 Allows to embed simple chart graphics using the Google Chart API
Similar to achart, c3chart, charter, googlechart, pchart
 This plugin used to use the Google Image Chart API. This API has been deprecated for years and finally stopped working in 2024. The plugin now relies on the Open Source QuickChart.io service. Old charts should continue to work, but will probably look different.
Download and Installation
Search and install the plugin using the Extension Manager. Refer to Plugins on how to install plugins manually.
Changes
- Version upped (2024-05-05 23:50)
- legends for pie charts are not supported in quickchart.io (2024-05-05 16:25)
- remove debug statement (2024-05-05 16:17)
- auto code cleanup (2024-05-05 16:09)
- use quickchart.io instead of Google (2024-05-05 15:47)
- Version upped (2021-09-20 23:50)
- added missing semicolon. fixes #13 (2021-09-20 10:17)
- Version upped (2021-09-19 23:50)
Syntax
Let's start with an example:
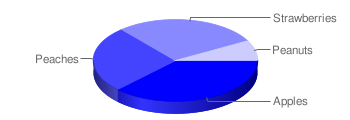
<gchart 350x120 pie3d #0000ff #ffffff right>
Apples       = 3
Peaches      = 23
Strawberries = 25
Peanuts      = 7
</gchart>
As you can see, the usage is simple. You give your data as name=value pairs inside the <gchart> tags. In the start tag you can add various optional options:
- Size give in the form
widthxheightin pixels. Defaults to320x140 - Type defaults to
pie3d, can be one of the followingpie3dfor a 3D pie graph1)pie2dfor a 2D pie graphlinefor a line graphsparklinefor a “sparkline” graphhbarfor a horizontal bar graphvbarfor a vertical bar graphqrfor a two-dimensional barcode
- Graph color this is the first hex color given. Defaults to the configuration (see below).
- Background color this is the second hex color given. Defaults to the configuration (see below).
- Alignment can be
left,centerorright. Defaults toright. - Value Display if
valueis given, the entered values are added to the graph - Title if you want to add a title to the graphic, give it in quotes. E.g.
“this is my Title”
Hex colors can be the typical 3 part RGB hexcodes known from HTML or can contain a 4th alpha transparency value.
For QR-codes, the first line of data may contain a unique letter L, M, Q or H to indicate the error correction level. The default value is L. The other lines are joined with a semi-colon (;) and encoded in the barcode:
<gchart qr 120x120>
M
URLTO:www.dokuwiki.org/plugin:gchart
</gchart>
Configuration
The default graph and background color can be set in the configuration manager to match the style of your template.
It is recommended to enable the fetchsize option to make use of image caching.
Limitations
- No encoding is used for the values, it might not work for big or many values
- An internet connection is needed (because quickchart.io servers are used)
- Only single dimensional charts (a single row of data pairs) are supported
- If this is too limiting for you I recommend one of the similar plugins